How to Save a Chart as an Image: Export, Convert and Share Charts from Any Web App
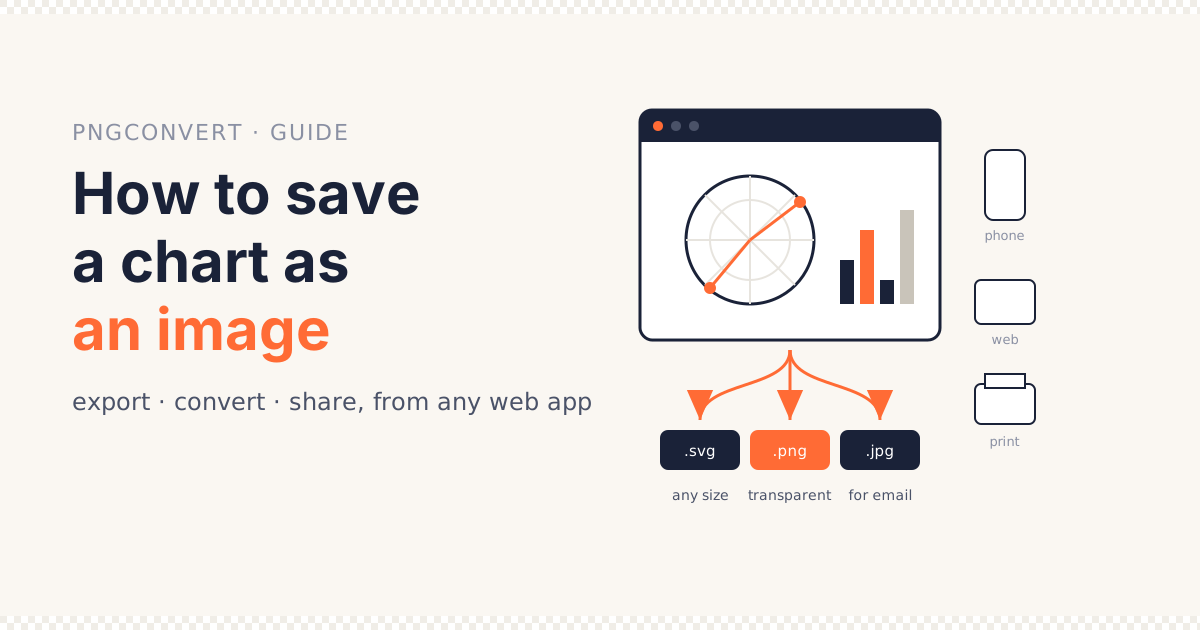
A chart on a web page is usually one of three things underneath: an SVG drawing, a PNG the server rendered, or a live canvas — and which one it is decides how you get it out. Pick the wrong route and you end up with a blurry 600-pixel screenshot of something that could have been a razor-sharp vector.
This guide is the route map. It covers every kind of chart a web app draws — spreadsheet charts, diagrams, and charts painted over an interactive map — and every destination: a slide, a post, a web page, a printer.
The tools it points to are the ones on this site, which run in your browser without uploading the chart. Where a third-party app is the example, it is linked, and it is free.
What you’ll learn
- The three ways a chart leaves a web app, and which to try first
- Which file format to ask for, and the one you should always keep
- How to take a screenshot that is sharp on a phone and usable in print
- How to save a chart drawn over a live map, where right-click fails
- Exact pixel sizes for web, Instagram, X, slides and print
Quick answer: to save a chart as an image, export as SVG if the app offers it, PNG if not, screenshot at 200% zoom as a last resort. Then convert once per destination — SVG to PNG at the width you need, PNG to JPG with a white fill for email, PNG to WebP for a page.
Three Ways to Save a Chart from a Web App
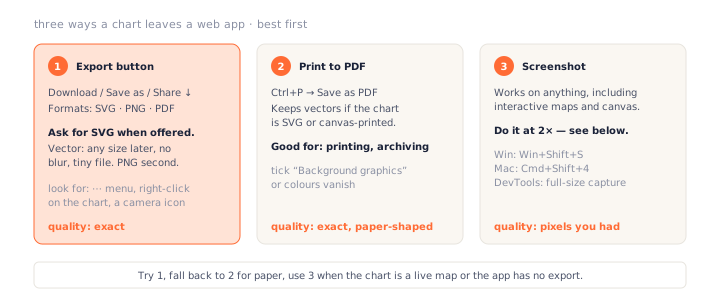
Every app is different, but there are only three doors to save a chart through, and they are worth trying in order.
1. The export button
Most chart and diagram apps have one, though it hides: a ⋯ menu on the chart, a right-click on the chart itself, a camera icon, or File → Download. It usually offers SVG, PNG, or PDF.
This is the best door because the app draws the chart again at full quality for the file, rather than copying the pixels on your screen.
2. Print to PDF
The second way to save a chart: Ctrl+P (Cmd+P) → Save as PDF. If the chart is an SVG on
the page, the PDF keeps it as vector, which means it prints sharp at any size. Tick
Background graphics in the print dialog or the chart’s colours may vanish.
3. The screenshot
The third way to save a chart works on absolutely anything, including charts drawn on a canvas over a live map. The cost is that you get exactly the pixels that were on screen — so the whole trick is putting more pixels on screen first, covered below.
Three examples, three doors
Save a chart from Excalidraw or diagrams.net
Door 1. Both export SVG directly. Save the SVG; it is the master copy of the chart.
Save a chart from Google Sheets or Excel Online
Door 1 again: the chart’s ⋮ menu has Download → SVG / PNG / PDF. SVG if you will ever resize it, PNG if you will not.
To save a chart from Excel on the desktop — the odd one out — right-click the chart → Save as Picture offers PNG, JPG, GIF, TIFF and SVG. Pick SVG there too; the PNG it writes is only as big as the chart on your screen.
Save a chart from an interactive map
Door 3. The free astrocartography chart calculator at AstroChart draws your planetary lines across an interactive world map — the lines are a canvas layer, the map is tiles loaded as you pan. That is a picture assembled live, not a file, and it needs the screenshot route. Its own section is below.
Which Format to Ask For
When the export menu gives you a choice, this is how to make it. The wrong pick here is the most common reason people have to save a chart twice.
| Format | What it is | Take it when | Watch out |
|---|---|---|---|
| SVG | Vector: shapes and text, not pixels | Always, if offered — any size later, no blur, tiny file | Fonts may substitute on another machine; rasterise to PNG before sharing widely |
| PNG | Lossless pixels, with transparency | Slides, documents, anything that must stay crisp | Fixed size — take the largest the app gives |
| A page, vector if the source was | Printing, archiving | Awkward to drop into a post; convert to PNG first | |
| JPG | Lossy pixels, no transparency | Email, Instagram, when a small file matters | Never as the master — detail is gone for good |
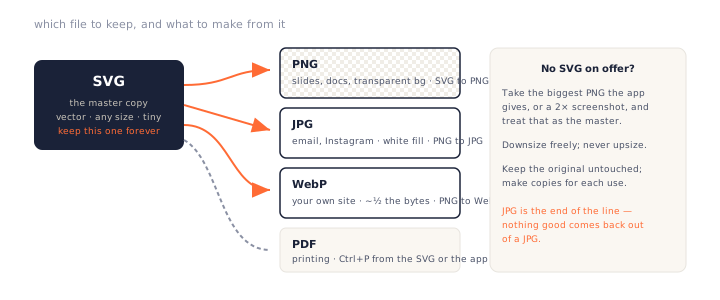
Keep one master copy of every chart as SVG, or as the largest PNG the app will give. Make a copy for each destination from that. Never make the JPG the master — nothing good comes back out of a JPG.
The Screenshot, Done Properly
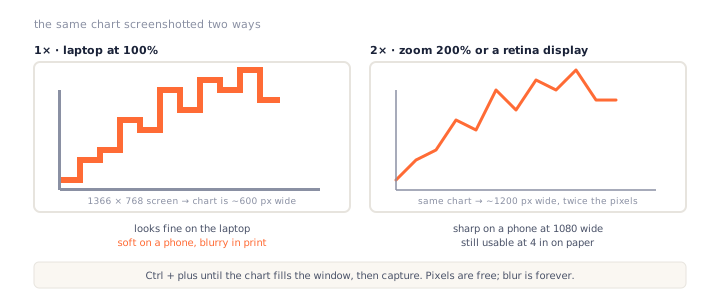
A screenshot is not a lesser way to save a chart if you take it right. The one rule: capture at least twice the pixels you will display.
Why 1× screenshots look soft
Save a chart that is 600 pixels wide on a 1366-pixel laptop becomes a 600-pixel image. Shown at 1080 wide on a phone, or printed 6 inches across, every pixel has to cover two or three — and that is the blur.
Getting 2×
Zoom the browser
Ctrl + + until the chart fills the window at 200%. The app redraws it
at the new size — SVG and canvas charts scale cleanly — and the screenshot now has twice the
pixels.
Or use a high-DPI screen
A MacBook or a 4K monitor at 200% scaling already captures at 2×. A 1080p screen at 100% does not, so zoom.
Capture the whole page in one go
For a chart taller than the window: in Chrome or Edge, F12 →
Ctrl+Shift+P → type capture full size screenshot. Firefox has
Take Screenshot → Save full page on right-click.
💡 Pro tip: hide the cursor and any hover tooltip before you capture. Move the
mouse off the chart, or press Esc; a tooltip baked into the image is the most
common reason to redo a screenshot.
How to Save a Chart Drawn Over a Live Map
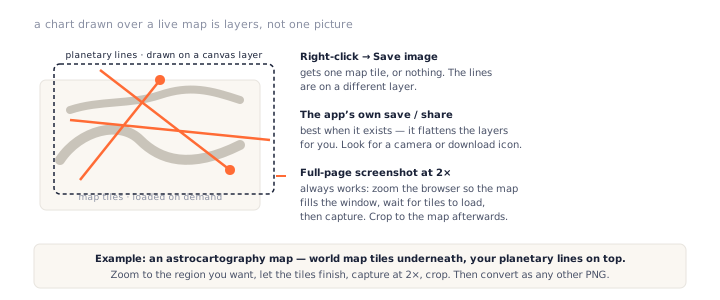
Some charts are not one picture at all. An astrocartography map is the clearest example: the world map is a grid of tiles fetched as you pan, and your planetary lines are drawn on a separate canvas layer on top. Right-click → Save image gets you one tile, or nothing.
Use the app’s own save first
If the app has a download or share control, it will flatten the layers for you. Look for a camera icon, a share button, or a “download chart” link near the map before you screenshot.
Otherwise: zoom, wait, capture, crop
Zoom to the region that matters
On an astrocartography map that is usually a continent or a country, not the whole world — the lines through Europe, say, if that is where you are deciding between cities. Fill the window with it.
Wait for every tile
Tiles load in a second or two; a grey square in the capture is one that had not arrived. Give it a moment after you stop panning.
Capture at 2× and crop
Browser at 200%, then the screenshot shortcut. Crop out the toolbar and sidebar afterwards — any image editor does it, and the JPG to PNG converter is not the tool for that step, so keep an editor handy.
From here the capture is a PNG like any other. Everything below applies.
A second interactive example: a birth chart wheel
To save a chart of a different shape from the same site: it also draws a birth chart wheel — a circle of houses and planets rather than a map. Wheels are usually SVG or a single canvas, so try right-click → Save image first; if the menu offers it, that is door 1 in disguise and you save a chart at full quality in one click.
If right-click gives nothing, the wheel is a canvas: zoom to 200% and screenshot, exactly as with the map. Either way, crop to the circle and you have a PNG with a solid background — so for a slide you may want the background keyed out before you use it.
SVG to PNG at the Size You Need
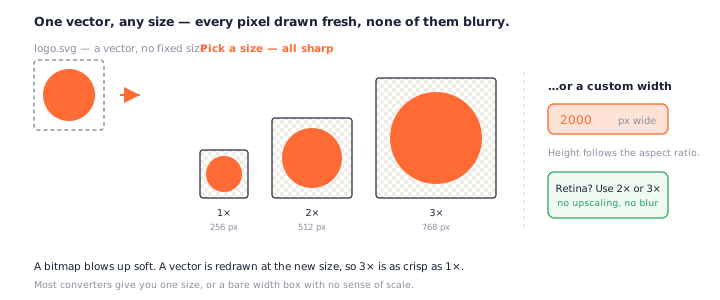
You managed to save a chart as SVG. The slide wants a 1920-pixel PNG; the thumbnail wants 400. One SVG makes both, without either being a resize of the other.
Rasterise, don’t resize
To save a chart as PNG from that SVG, drop it on the SVG to PNG converter, pick 1×, 2×, 3× or type a custom width, and download. Each output is drawn fresh from the vector at that size, so the 400-pixel version is as crisp as the 1920.
Two things an SVG chart can lose
Fonts
If the chart’s labels use a font that is not embedded, the converter substitutes one, and the labels shift. Most apps embed or outline their fonts on export; if yours does not, rasterise to PNG on the machine that has the font.
Linked images
An SVG that references an external picture — a logo by URL — will render without it. Check the PNG for a blank rectangle before you send it.
Transparent or White: Decide Before You Convert
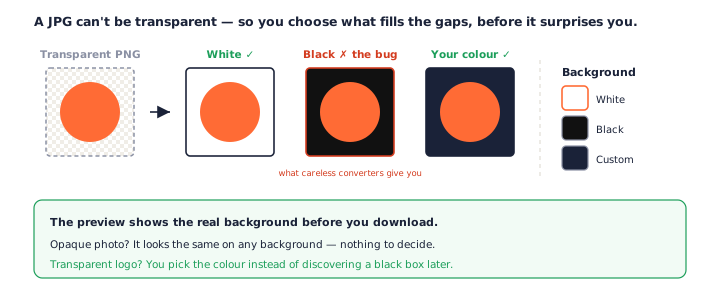
Save a chart as SVG or PNG and it usually comes with a transparent background, which is ideal for a slide and a problem for an email.
Keep it transparent
Slides, documents, anything the chart will sit on top of: save a chart for those as PNG. Stay in PNG; the transparency survives.
Fill it
JPG cannot hold transparency, so converting to JPG means choosing what goes behind the chart. The PNG to JPG converter asks — white for a document, or the exact background colour of the page it will sit on, so the box disappears. Left to a converter that does not ask, you get white at best and black at worst.
Sizes by Destination
The pixel count is the one number that decides whether the chart looks right where it lands. Save a chart at the right size the first time and you never come back to this table. Here is the table to keep.
| Where it is going | Pixels (long edge) | Format | Background |
|---|---|---|---|
| Blog post or web page | 1200–1600 | WebP, PNG fallback | Transparent fine |
| Instagram post | 1080 × 1080 or 1080 × 1350 | JPG or PNG | Solid |
| X / LinkedIn link card | 1600 × 900 | PNG | Solid |
| Slide deck | 1920 × 1080 | PNG or SVG | Transparent fine |
| Print, 6 in wide | 1800 (300 dpi) | PDF or PNG | White |
| Poster, 24 in wide | 7200 → use SVG | SVG or PDF | White |
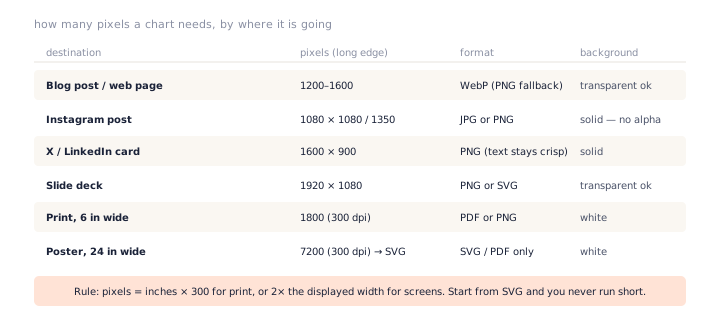
For screens, make the image twice the width it will be displayed at. For print, multiply inches by 300. Start from SVG and neither number is ever a problem.
Shrinking It for a Web Page
Save a chart at 1600 pixels as PNG, with gradients or a map behind it, and the file can be 2 MB. On your own site, that is the slowest thing on the page.
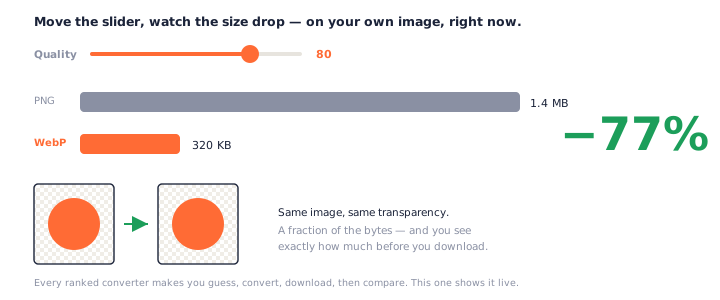
PNG to WebP, and how much you save
The PNG to WebP converter shows the file size dropping as you move the quality slider, so you can stop exactly where the chart still looks right. Flat charts with few colours: use the lossless option and still save; photographic or map backgrounds: lossy at 80 is usually half the bytes with no visible change.
Keep the PNG too
WebP is how you save a chart for the page. The PNG (or the SVG) stays as the master for the next time the chart is needed somewhere else.
Printing a Chart
Paper is the destination that punishes a small source hardest, and the place people most often regret how they chose to save a chart, so save a chart for print from the vector whenever one exists.
From SVG or PDF
Print the PDF, or open the SVG in a browser and print that — both are vector and come out sharp at any size. This is the poster route.
From PNG
To save a chart for print from a PNG, check the pixels first: width in inches × 300. A 1200-pixel PNG prints well at 4 inches and badly at 12. If it is short, go back to the SVG and rasterise wider rather than scaling the PNG up.
Backgrounds on paper
A transparent chart prints on white, which is what you want. A dark-themed chart prints as a solid block of ink; switch the app to light mode before exporting, if it has one.
Margins and bleed
Leave the chart’s own margin in the file rather than cropping to the axes — printers need 3 mm of nothing at the edge, and a title jammed against the paper edge is the first thing a print shop sends back. If the chart will be trimmed after printing, add 3 mm of background colour beyond the trim line instead.
How to Save a Chart as an Image: The Whole Thing in Three Steps
- Get the biggest, cleanest source the app offers. Look for an export or download control and choose SVG if it is there, PNG at the largest size if not. Only when the app offers nothing, zoom the browser to 200% and take a screenshot.
- Convert once to the format the destination wants. SVG to PNG at the exact pixel width; PNG to JPG with a white fill for email or Instagram; PNG to WebP for your own site. Keep the original untouched.
- Check it where it will be seen. Open the result on a phone, or print one page. Blur, a black box behind the chart, or a 4 MB file are all visible in ten seconds and fixable in one more conversion.
Frequently Asked Questions
How do I save a chart as an image with a transparent background?
Save a chart as SVG or PNG — both keep transparency. If the app only gives you a screenshot, the background will be whatever colour the page was. For SVG, run it through the SVG to PNG converter with the background set to transparent; the chart lands on nothing, ready for a slide.
Why is my chart blurry when I paste it into a document?
It was captured at fewer pixels than it is being shown at — typically a 1× screenshot of a 600-pixel chart placed 6 inches wide on a page, which needs 1,800. Export as SVG and rasterise at the size you need, or zoom the browser to 200% before screenshotting.
What is the best format to save a chart in?
SVG as the master copy whenever the app offers it: it is vector, so it can be made any size later without blur, and the file is tiny. From that one SVG make a PNG for slides, a JPG for email and a WebP for a web page. If there is no SVG, the largest PNG the app gives is the master.
How do I save an interactive map or chart that has no download button?
To save a chart drawn over a map, right-click will not work — the map tiles and the chart lines are separate layers. Zoom the browser so the map fills the window, wait for every tile to load, then take a full-page screenshot (Windows: Win+Shift+S; Mac: Cmd+Shift+4; or the browser’s DevTools “capture full size screenshot”). Crop afterwards.
What size should a chart image be for Instagram or X?
Save a chart for Instagram at 1080 × 1080 (square) or 1080 × 1350 (portrait), JPG or PNG, no transparency. X and LinkedIn link cards: 1600 × 900, PNG so axis labels stay crisp. Make each one from the SVG or the largest PNG rather than resizing a small screenshot up.
How many pixels does a chart need to print well?
300 pixels per printed inch. A 6-inch-wide chart needs about 1,800 pixels; a 24-inch poster needs 7,200, which is why posters should come from SVG or PDF rather than PNG. Use the SVG to PNG converter’s custom width to hit the number exactly.
Why does the JPG of my chart have a black or white box around it?
JPG cannot store transparency, so the converter had to fill the empty area with something. Ours lets you pick the fill colour — white for a document, or the page’s own background so it disappears. See the PNG to JPG converter; if you need the transparency kept, stay with PNG.
Next Steps
Find the export button in the app you use most, save a chart as SVG once, and make the three copies from it. After that the workflow is a minute per chart, and none of the files ever leave your machine.
The converters this guide leans on: SVG to PNG, PNG to JPG and PNG to WebP. If the chart is also going to be an app or site icon, PNG to ICO and the favicon generator finish the job. More walkthroughs are on the PNGConvert guides page.